Liquid level control loops, while among the most common control loops, have some unique and very distinctive characteristics:
- Liquid level is usually not a self-regulating process, but an integrating one.
- Intuitive general rules of thumb used for tuning, such as “If it’s cycling, reduce the gain,” do not apply and will often produce the opposite effect.
- Liquid level control loops, if once properly tuned, do not usually need retuning, although they may appear to go out of tune due to the onset of valve stiction or impellor wear.
This presentation first presents an approach to level control tuning, which is based on an idealized process model. Many actual level control loops can be approximated by this idealized process model. Later in the section, some of the characteristics of nonidealized level control systems are considered.
Most processes require extensive testing to obtain even their approximate process models. Most liquid level control loops, however, readily yield to an analytical approach because their process models can be formulated, desired performance parameters established, and from this their controller tuning parameters established, and from this their controller tuning parameters can be calculated. Once this is done, other attributes of the control loop such as the period of oscillation can be predicted.
The counterintuitive nature of level controllers makes their tuning by trial-and-error techniques difficult. On the other hand, the determination of their tuning parameters by analytical means is a natural choice and for that reason liquid level control loops should be engineered, not tuned.
In the following paragraphs, the discussion will start with an ideal world. After that, some of the non-ideal characteristics of real installations and worst-case conditions (even if they are very unlikely to occur) will be discussed.
Idealised Model
An idealized liquid level control system is shown in Figure 13.1. Attributes of this idealized system are:
- The tank has constant cross-sectional area.
- The level controller is cascaded to a flow controller.
- A valve positioner is installed on the flow control valve.
- All inflow goes to outflow; the tank is merely a buffer storage tank.
- The maximum outflow is the same as the maximum inflow.
- The tank is of significant size relative to the flow rates.
- There is no thermal effect such as in the case of boiler drum level control.
- The level controller setpoint is constant.
The consequences of the previous system attributes are:
- The level process is linear.
- Up or downstream pressure, line loss, or pump curve have no effect on loop behaviour.
- The control loop performance is not affected by valve size.
- There is no dead time in the loop.
- The speed of response of the flow loop is significantly faster than that of the level in the tank; therefore, the dynamics can be ignored.
- Response to set-point change need not be considered because set-point changes are rarely made.
Figure 13.1 describes a common installation where the level controller manipulates the outflow from the tank in response to changes in inflow. The level controller can also manipulate the inflow in response to varying demands for the outflow. The discussion in the following paragraphs is applicable to both cases.
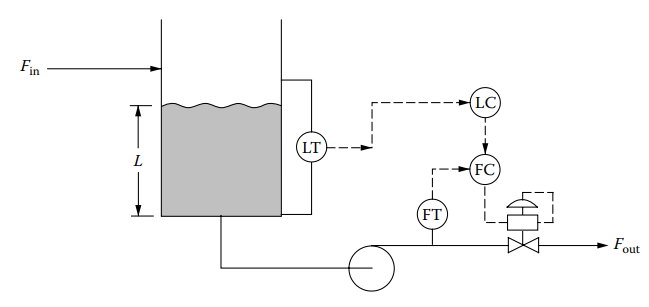
Figure 13.1 [Liquid level control of an ideal process].
Time Constant of the Tank
A key parameter for the analysis of this process is the tank holdup time, also called the tank time constant. If the tank geometry (diameter and distance between the level taps) and maximum outflow rate (flow rate corresponding to 100% of the level measurement span) are known, then the tank time constant can be calculated as
(1) ![]()
where ![]() = tank time constant;
= tank time constant; ![]() = tank hold up quantity, between upper- and lower-level sensor taps; and
= tank hold up quantity, between upper- and lower-level sensor taps; and ![]() = maximum flow rate.
= maximum flow rate. ![]() and
and ![]() should be in compatible units, such as “litres” and “litres per minute,” in which case the time constant will be in minutes.
should be in compatible units, such as “litres” and “litres per minute,” in which case the time constant will be in minutes.
A block diagram of the control loop with a PI controller is shown in Figure 13.2. If the loop operates at constant set point, then the response to a load disturbance (i.e., to a change in the inflow ![]() ) is of more interest, and the set-point response can be neglected. However, in addition to the response of the level to a change in
) is of more interest, and the set-point response can be neglected. However, in addition to the response of the level to a change in ![]() , there is also interest in the response of the outflow,
, there is also interest in the response of the outflow, ![]() , to a change in
, to a change in ![]() . The transfer functions of these two responses can be derived from Figure 13.2.
. The transfer functions of these two responses can be derived from Figure 13.2.

Figure 13.2 [Block diagram of a liquid level control loop for an ideal process].
(2) 
(3) 
where ![]() is the controller gain;
is the controller gain; ![]() is the integral time of the controller in minutes per repeat; and
is the integral time of the controller in minutes per repeat; and ![]() is the time constant of the tank in minutes.
is the time constant of the tank in minutes.
According to these equations, the loop acts as a second order system. These transfer functions can also be written using the traditional servo-mechanism terminology as
(4) ![]()
(5) ![]()
where ![]() , the damping ration and
, the damping ration and ![]() , the natural frequency are given by
, the natural frequency are given by
(6) ![]()
(7) ![]()
The damping factor is a dimensionless number; the natural frequency is in radians per minute, if ![]() is in minutes per repeat and
is in minutes per repeat and ![]() is in minutes.
is in minutes.
Many practicing engineers may be more familiar with the term decay ratio (![]() ), rather than the damping factor,
), rather than the damping factor, ![]() .
.
The damping factor and decay ratio are related as follows:
(8) ![]()
(9) ![]()
For example, the familiar quarter-amplitude decay ratio in terms of damping factor is ![]() .
.
Determining Tuning Parameters
In addition to knowing the tank hold-up time, ![]() , the analytical determination of tuning parameters requires choosing values for three design parameters:
, the analytical determination of tuning parameters requires choosing values for three design parameters:
 – The maximum anticipated step change in disturbance (inflow) that can be expected, in percent of full scale measurement of the inflow.
 – The maximum allowable deviation from set point, in percent of full scale level measurement, resulting from a step disturbance of size
  .
.- DR – the desired decay ratio after such a step disturbance.
Once the above three values have been determined, a value for T_L can be obtained and Equation 1.1 can be used to convert decay ratio to damping factor. This will then permit one to derive the equations tabulated in Tables 13.1, 13.2, and 13.3.
Table 1.1 provides equations to calculate tuning parameters, while Tables 1.2 and 1.3 give equations for the calculation of various characteristics of the level in the tank and of the response to a step change in inflow. In Tables 13.1, 13.2, and 13.3:
(10) ![]()
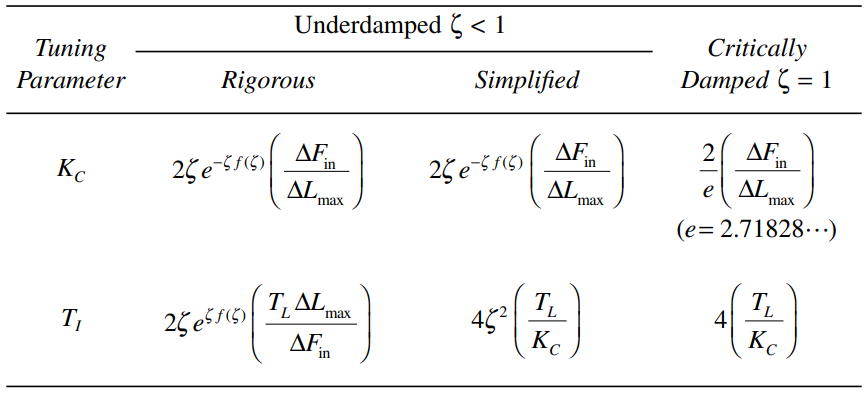
Table 13.1 [Equations for Calculating the Tuning Parameters of a PI Level Controller for an Ideal Level Process]
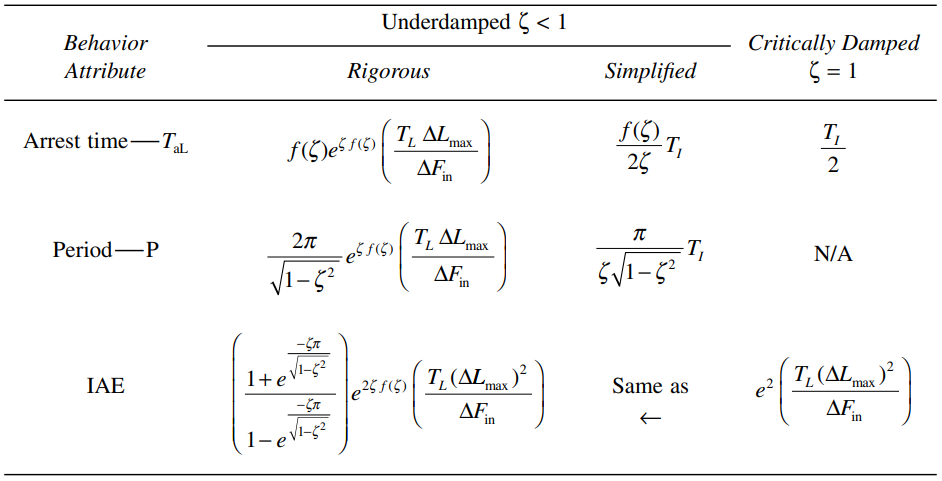
Table 13.2 [Equations for Calculating some of the predicted behaviour attributes of control on an ideal level process]
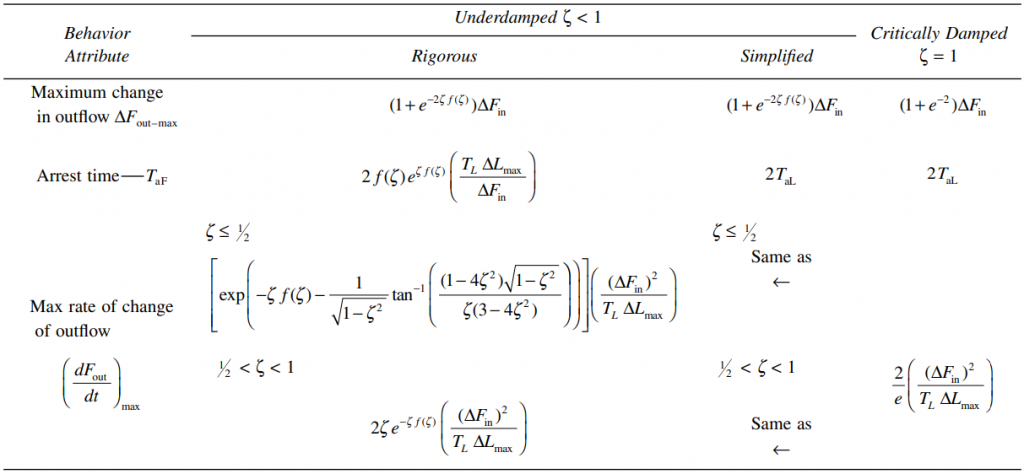
Table 13.3 [Equations for Calculating the Predicted Behaviour Attributes of Level Controls]
In the three tables, the columns labelled “rigorous” provide equations that are entirely a function of the following four fixed or chosen parameters – ![]() ,
, ![]() (as determined from the chosen decay ratio),
(as determined from the chosen decay ratio), ![]() , and
, and ![]() . The column labelled “simplified” produces the same results, calculated in terms of a previously calculated quantity.
. The column labelled “simplified” produces the same results, calculated in terms of a previously calculated quantity.
Once the tuning parameters have been calculated, the predicted behaviour of the level and the outflow can be calculated from Tables 13.2 and 13.3. In Table 13.2, the level arrest time, ![]() , is the time period beginning at the disturbance and ending when the maximum deviation from set point is reached.
, is the time period beginning at the disturbance and ending when the maximum deviation from set point is reached.
In Table 13.3, the outflow arrest time, ![]() , is the time period that begins with the disturbance and ends when the maximum change in outflow is reached. The maximum rate of change of outflow is provided because it is this quantity, rather than the size of the outflow change itself, that can be the maximum disturbance to a downstream process unit.
, is the time period that begins with the disturbance and ends when the maximum change in outflow is reached. The maximum rate of change of outflow is provided because it is this quantity, rather than the size of the outflow change itself, that can be the maximum disturbance to a downstream process unit.
The equations given in Tables 13.1, 13.2, and 13.3 describe this tuning technique, but they are not very useful due to the large amount of computation required. For three specific decay ratios, Tables 13.4 and 13.5 provide equations for calculating tuning settings, level and outflow parameters. The three decay ratios chosen are: 1) critically damped, 2) quarter-decay ratio and 3) 1/20 decay ratio.
The critically damped decay ratio is chosen because it is a recognized basis for tuning. Quarter amplitude damping is chosen because of its familiarity. The third response, although less familiar, is chosen because it provides both the minimum IAE and the lowest maximum rate of change in outflow. Figure 13.3 depicts the level responses when the level controllers are tuned on the basis of these three forms of responses with equal values of maximum deviation.
Tables 13.4 and 13.5 also provide correction factors to account for two real-world phenomena:
- The use of non-cascade control
- The presence of dead time in the control loop
In the equations, ![]() is the ratio,
is the ratio, ![]() and
and ![]() is the valve gain. The correction factors were determined as a “best fit” to simulation results, for the values of
is the valve gain. The correction factors were determined as a “best fit” to simulation results, for the values of ![]() between 0.0 and 0.5.
between 0.0 and 0.5.
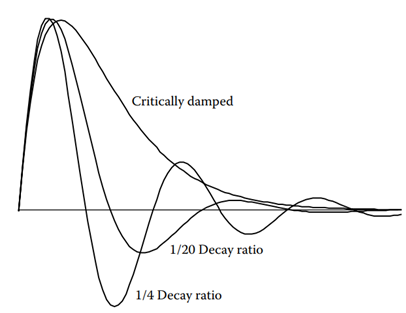
Figure 13.3 [Response of the levels to equal maximum deviation when the controllers are tuned for the noted three decay ratios].
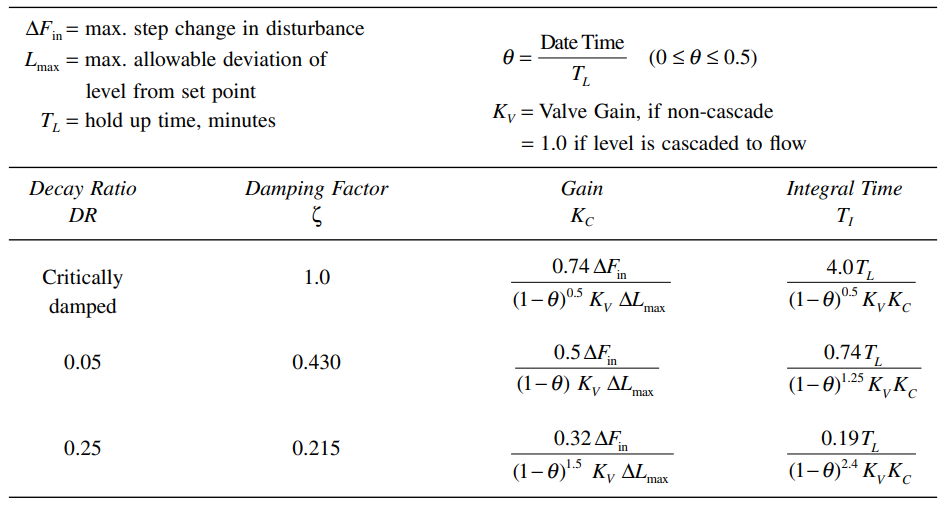
Table 13.4 [Working equations for calculating tuning parameters for a PI Level Controller for a process with dead time and non-cascade control]
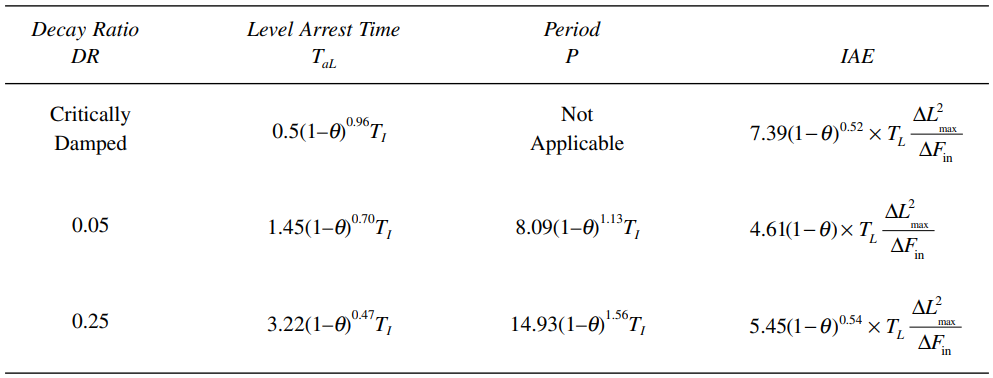
Table 13.5 [Working equations for calculating predicted behaviour attributes of level response to a step change in inflow, level control loop with dead time and non-cascade control]
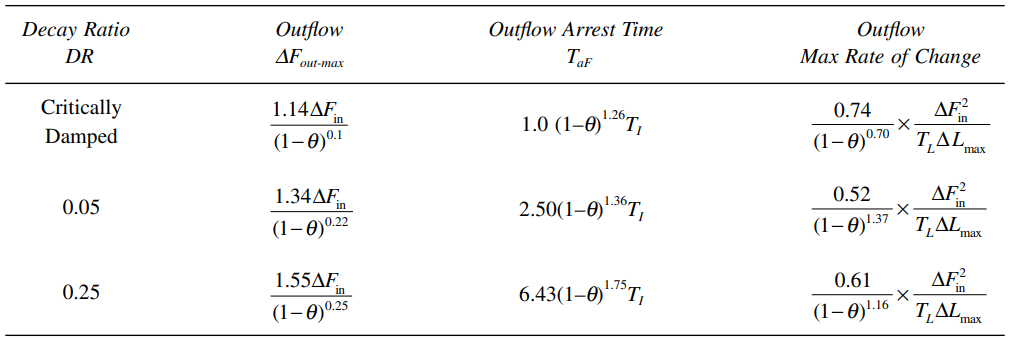
Table 13.6 [Working equations for calculating predicted behaviour attributes of outflow response to a step change in inflow; level control loop with dead time and non-cascade control]
Non-ideal Processes
The discussion so far has been based on an idealized process model. Many real applications will deviate from the idealized model. In the following paragraphs some commonly encountered situations will be described, along with suggested procedures for coping with them.
Irregular Vessel Shapes
The discussion so far has been based on an idealized process model. Many real applications will deviate from the idealized model. In the following paragraphs some commonly encountered situations will be described, along with suggested procedures for coping with them. For irregularly shaped vessels, such as horizontal or spherical tanks, the direct use of the level measurement signal as the input to the level controller may result in highly nonlinear process characteristics and undesirable control loop behaviour. In this case, the loop can be linearized by converting the level measurement into the volumetric holdup in the vessel, which can be computed from the vessel geometry and the actual level. In this case, the converted measurement signal should be scaled in 0 to 100% of maximum volumetric holdup.
No Cascade Loop
The discussion so far has been based on an idealized process model. Many real applications will deviate from the idealized model. In the following paragraphs some commonly encountered situations will be described, along with suggested procedures for coping with them. For irregularly shaped vessels, such as horizontal or spherical tanks, the direct use of the level measurement signal as the input to the level controller may result in highly nonlinear process characteristics and undesirable control loop behaviour. In this case, the loop can be linearized by converting the level measurement into the volumetric holdup in the vessel, which can be computed from the vessel geometry and the actual level. In this case, the converted measurement signal should be scaled in 0 to 100% of maximum volumetric holdup.

Figure 13.4 [Block diagram of a conventional liquid level control loop, where there is no cascade slave controller and the level controller directly throttles the valve of an ideal process].
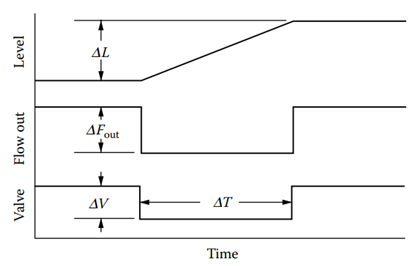
Figure 13.5 [Illustration of a test to estimate the apparent holdup time and valve gain for non-cascade level control].
The testing is done in the following sequence: First, switch the controller to manual and change the previously constant output signal by a small amount, say, ![]() (refer to Figure 13.5).
(refer to Figure 13.5).
In response, the outflow will change by an amount ![]() and the level will start changing. After a certain period of time, say
and the level will start changing. After a certain period of time, say ![]() , move the controller output back to where it was before the test. As a consequence, the level should stop changing. Once the level has stabilized, determine the change in level,
, move the controller output back to where it was before the test. As a consequence, the level should stop changing. Once the level has stabilized, determine the change in level, ![]() , that occurred during the test.
, that occurred during the test.
Convert the readings for ![]() ,
, ![]() , and
, and ![]() into percent of full scale.
into percent of full scale.
The equation for estimating the apparent holdup time is:
(11) ![]()
and the valve gain is
(12) ![]()
Dead Time
The ideal level process has neither dead time nor lag time, but real processes can have either or both. For example, in case of the level-flow cascade loop in Figure 13.1, the flow control loop may have a finite response time. If there is a dead time in the loop, ![]() , the ratio of dead time to holdup time should be calculated and used in the equations listed in Tables 13.4, 13.5, and 13.6. Similarly, the actual valve gain (
, the ratio of dead time to holdup time should be calculated and used in the equations listed in Tables 13.4, 13.5, and 13.6. Similarly, the actual valve gain (![]() ) should be used in Table 1.4 (for cascade loops,
) should be used in Table 1.4 (for cascade loops, ![]() ).
).
Unequal In and Outflows
When determining step changes in the inflow to a vessel, it should always be the actual flow that enters the tank. Hence the change in feed rate, ![]() , can be due to any cause, such as actual change in vessel feed rate, change in the liquid/vapor ration of the feed, change in reboiler heat, or change in liquid load on the trays in the distillation tower.
, can be due to any cause, such as actual change in vessel feed rate, change in the liquid/vapor ration of the feed, change in reboiler heat, or change in liquid load on the trays in the distillation tower.
Flashing Liquids
There are cases where flashing liquids result in a false indication of level. An example is the “shrink and swell” effect in a boiler drum. The shrink and swell effect can be approximated as dead time; hence, the dead time correction factors in Tables 13.4, 13.5, and 13.6 may be used.
Sinusoidal Disturbance
If a sinusoidal variation in inflow is anticipated (for instance, due to cycling of a process controller at an upstream process unit), then the maximum variation in level and the amplitude of variation of outflow should be investigated. If the frequency of the sinusoidal variation is not known in advance, then a worst case condition could be assumed for the investigation, where the frequency of inflow disturbance in the same as the natural frequency of the level control loop.
An oscillating input will cause both the level and the outflow to oscillate with the same period. If the process can be approximated by the ideal model, which was defined at the beginning of this section, and if the inflow oscillates with a known amplitude and period (![]() ), then Figures 2.36l and 2.36m can be used to determine the amplitude of both the level and of the outflow oscillations.
), then Figures 2.36l and 2.36m can be used to determine the amplitude of both the level and of the outflow oscillations.
The undamped natural frequency, ![]() , is calculated from the damping factor,
, is calculated from the damping factor, ![]() , which is obtained from Table 1.4, based on the chosen response (decay ratio) to a step disturbance and from the tuning parameters. If the process fits the ideal process model, the following equation can be used to calculate
, which is obtained from Table 1.4, based on the chosen response (decay ratio) to a step disturbance and from the tuning parameters. If the process fits the ideal process model, the following equation can be used to calculate ![]() .
.
(13) ![]()
Otherwise, the period, P, given by Table 1.5, should be used to calculate ω_n from the equation below:
(14) ![]()
(15) ![]()
From the period of oscillation of the input, ![]() , the frequency in radians per minute can be calculated from:
, the frequency in radians per minute can be calculated from:
(16) ![]()
The frequency ratio ![]() in Figure 1.6 should be used to calculate
in Figure 1.6 should be used to calculate ![]() . (If the frequency of the disturbance is unknown, then for a worst case analysis, use a frequency ratio of 1.0.) From this and from the amplitude of the disturbance oscillation,
. (If the frequency of the disturbance is unknown, then for a worst case analysis, use a frequency ratio of 1.0.) From this and from the amplitude of the disturbance oscillation, ![]() , one can calculate the predicted amplitude of oscillation of level about the set point,
, one can calculate the predicted amplitude of oscillation of level about the set point, ![]() .
.
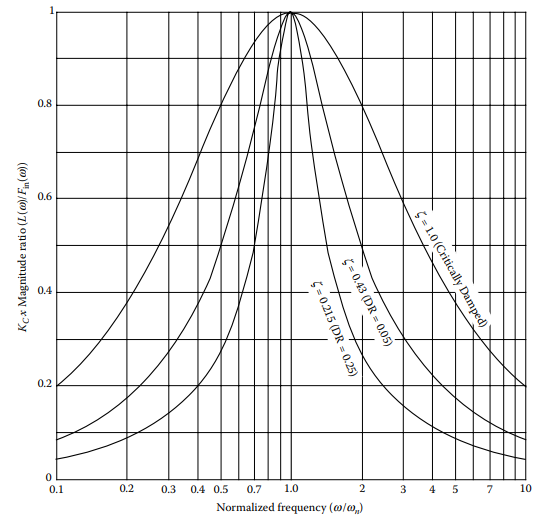
Figure 13.6 [Magnitude ratio of changes in level to sinusoidal changes to inflow].
If the peak deviation from set point (one half the amplitude of oscillation) exceeds the allowable maximum deviation, then ![]() should be increased by the relation:
should be increased by the relation:
(17) ![]()
After this, one can return to Tables 13.4, 13.5, and 13.6 and calculate ![]() and the predicted attributes of the response.
and the predicted attributes of the response.
If the magnitude and period of oscillation of the input are assumed or known, use Figure 13.7 to calculate the magnitude ratio of oscillations of outflow to inflow,
(18) ![]()
then calculate the amplitude of oscillation of the outflow.
As a final check, if there are level control loops in series, such as in case of a train of distillation towers, it is necessary to check the natural frequency of each tower. Ideally, the natural frequency of each tower should be no more than half the natural frequency of the preceding tower.
Since the size of the towers (holdup time) cannot be changed, the best “handle” for adjusting the ratio of the natural frequencies is to increase ![]() for the downstream tower or to decrease
for the downstream tower or to decrease ![]() for the tower upstream.
for the tower upstream.
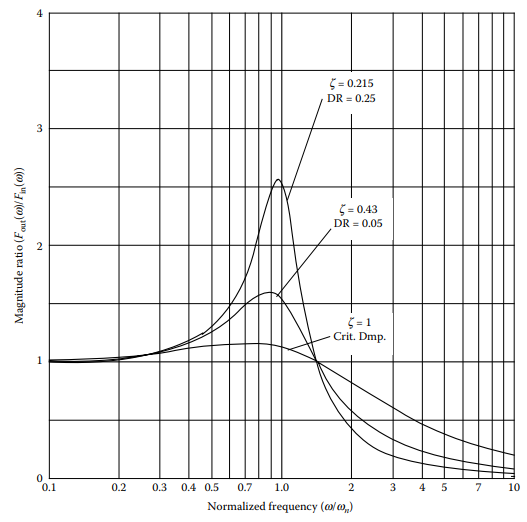
Figure 13.7 [Magnitude ratio of changes in outflow to sinusoidal changes to inflow].
Averaging Level Control
Many liquid level loops are not critical and one can tolerate fluctuation, even offset in levels, if it smooths out the flow to a downstream process unit. This can be accomplished by using a proportional-only controller. This technique is called “averaging liquid level control.” Assuming that the allowable excursions above and below set point are equal, then the controller gain should be set according to the equation
(19) ![]()
or the proportional band should equal ![]() and the bias (manual reset) should be set to 50%.
and the bias (manual reset) should be set to 50%.
With this arrangement, if the disturbance is such that a controller output of 50% is required, the level will be on set point. Otherwise, there will be a steady-state offset between set point and level measurement. When a step change in inflow occurs, the level will respond as a first-order lag with a time constant equal to the holdup time divided by the controller gain.
This technique ensures that the level never exceeds the limits because at the limits, the outflow is either at 0 or 100%. This technique also provides the lowest rate of change of the outflow, hence the minimum disturbance to a downstream processing unit. The disadvantage of this method is the fact that the level is rarely at set point. This is probably more of a disadvantage from the operator’s acceptance point of view than any other.