The primary purpose of controllers is to free operators from the need to constantly monitor and adjust the process being controlled. When operating in automatic mode, the controller aims to maintain the controlled variable, also known as the process variable, at the set point. The effectiveness of the controller in achieving this objective is largely dependent on the tuning parameters that have been set.
Disturbances
The main function of a controller is to maintain the controlled variable in close proximity to the desired setpoint at all times. The effectiveness of this objective is dependent on several factors, such as the response rate of the process, its control modes, the controller’s parameters, and the magnitude and frequency of external disturbances.
Sources of Disturbances
There are three primary sources of disturbances in a control loop: set point, load, and noise. Noise refers to a random disturbance with a frequency distribution that exceeds the control loop’s bandwidth, and the controller typically has no effect on it other than possibly amplifying it and passing it on to the final actuator. This can cause excessive wear and even lead to failure over time.
Set point and load changes have different effects on the control loop’s behavior due to the dynamics in their path. A controller that is tuned to track set point changes may respond sluggishly to load variations, while a controller that is tuned to correct disturbances may overshoot when its set point is changed.
Set Point
In a continuous process plant, the set point refers to the desired value of the controlled variable and is usually adjusted by the operator. However, for many control loops in such plants, the set point remains constant for long periods of time, ranging from days to even months.
For instance, variables such as drum-level and steam temperature of a boiler, as well as pressure and level variables, pH or process and effluent streams, most product-quality variables, and most temperature loops typically maintain a constant set point. These loops are not affected by changes in set point, but they still need to deal with load upsets in real-time.
The Load
In most processes, load changes are inevitable and result from variations in the flow rate of the input and output streams. This is true for all processes except for pure-batch processes, where there is no flow in or out of the system. Controllers in such processes must be designed to deal with the constantly changing load.
For instance, a liquid-level controller regulates the flow of a particular liquid stream, while the other streams constitute the load. To maintain the liquid level at the set point, the controller manipulates the flow rate of the liquid stream while balancing it with the combined flow rates of other streams, which can fluctuate unpredictably.
In a continuous process plant, most control loops operate as regulators, with the set point remaining unchanged for long periods, often days or even months. However, in a dynamic process, the load changes frequently, whereas the set point may never change. For instance, in a boiler, feedwater flow is manipulated to control drum level, and it must balance the combined flows of steam and blowdown leaving to maintain the level at the set point. Such loops must contend with load upsets in real-time, but the set point response is of no importance to these loops.
Dynamics
The concept of process dynamics encompasses capacitance, inertia, resistance, time constant, dead time, or their combinations. Changing the set point does not involve any dynamics, unless intentionally included to filter the set point.
However, the load path always has dynamics. Load variables are typically the flow rates of streams manipulated by the controller. Therefore, the dynamics in their path to the controlled variable are similar or identical to those in the control loop itself.
Figure 12.1 illustrates the essential elements of a control loop, including disturbance sources and dynamics. Most commonly, the dynamics are shared by both the load disturbance and the controller output, meaning that the load and manipulated streams enter the process at the same point. For instance, in the control of liquid composition at the exit of a blender, both the manipulated and load streams comprising the blend are introduced at a common entry point.
Less frequently encountered is the process where the dynamics in these two paths differ.

Figure 12.1 [Load variables always pass through the dominant dynamic elements].
Step Responses
Step testing is a recommended method for tuning control loops that are subject to disturbances whose frequency content is unknown. Periodic disturbances can pose a challenge for control loops that are capable of resonating at a particular period. Such disturbances are usually found in cascade loops and in process interactions where controllers manipulate valves in series or in parallel.
Step disturbances are the most challenging test for a controller as they contain all frequencies, including zero. This makes it an excellent test for loops that are subject to random disturbances. Step changes are common in industry and can be caused by sudden start-up and shutdown of equipment, starting and stopping of multiple burners, pumps, and compressors, and capacity changes of reciprocating compressors. If a control loop can respond well to a step disturbance, then it can handle ramp or exponential disturbances more easily.
Step changes are the easiest test to administer as they only require an estimate of their size and can be carried out manually. In contrast, pulses require duration estimates, and doublet pulses need balancing. Even loops that operate at a constant set point are tested or tuned using step changes in set point. Figure 12.2 shows an example of a step response with a ¼ decay ratio.
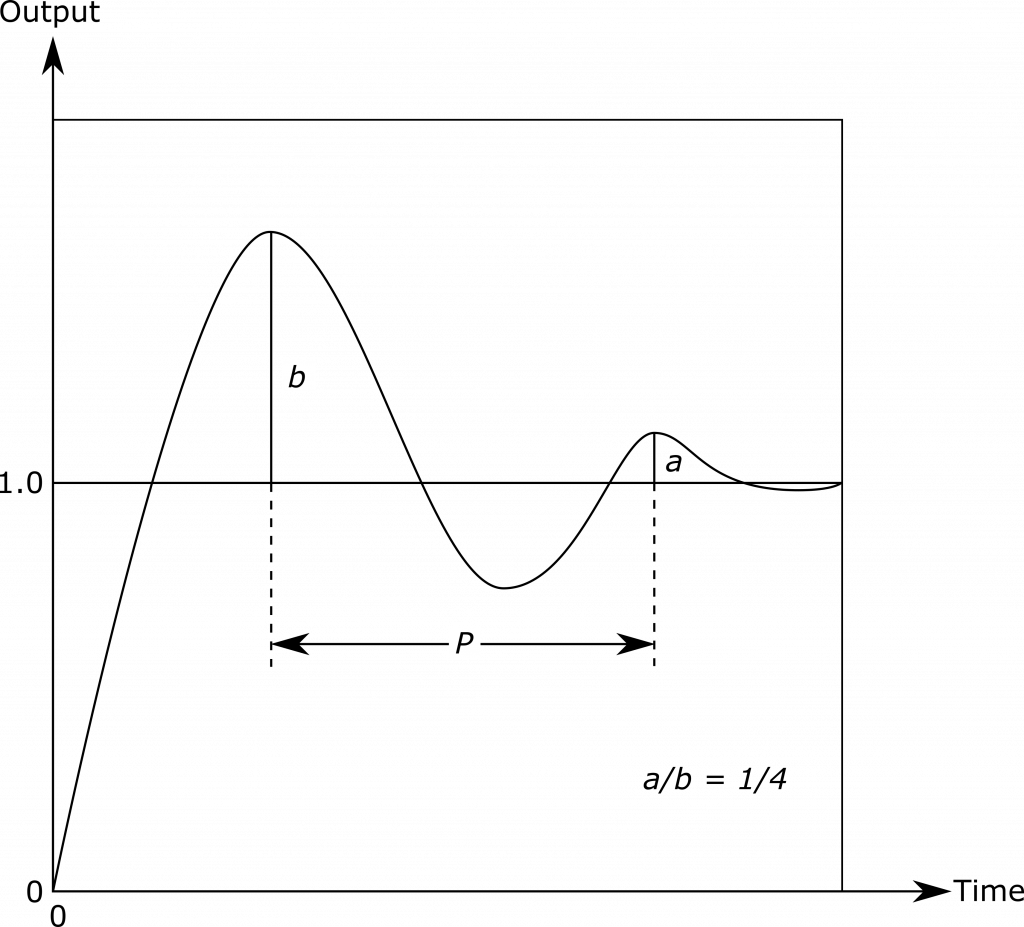
Figure 12.2 [Step response curve of a control loop tuned for ¼ decay ratio]
Comparing Set-Point and Load Responses
The typical steady-state process gain for a flow loop is between 1 and 2, indicated by the controller output falling between 50% and 100% when the flow measurement is at full scale. The proportional gain of a flow controller is usually between 0.3 and 1.0, with the higher value associated with processes that have lower steady-state gain. Therefore, the proportional loop gain for a typical flow loop falls between 0.6 and 1.0. This means that, by proportional action alone, a step change in set point will move the controller output approximately the correct amount to produce the same change in flow, which gives excellent set-point response.
However, this is not the case for other loops, such as level control. To maintain a constant level, the controller must match the vessel’s inflow and outflow precisely. Changing the set point will cause the controller to change the manipulated flow, but only temporarily. When the level reaches the new set point, the manipulated flow must return to its original steady-state value. As a result, no steady-state change in output is required for a level controller to respond to a set-point change.
In contrast, most other processes, such as temperature, pressure, and composition, have steady-state gains higher than those of a flow process and are dominated by lags. This allows for the use of higher controller proportional gain for tight load regulation. However, a set-point step moves the controller output far more than required to drive the controlled variable to the new set point, producing a large overshoot. To minimize set-point overshoot, the controller must be detuned with lower gain and longer integral time than is optimum for load regulation or a filter must be applied to the set point.
Figure 12.3 compares the responses to steps in set point and load for a process with distributed lag, such as a dashed exchanger, distillation column, or stirred tank. The time scale is normalized to ![]() , which is the time required for the distributed lag to reach 63.2% of the full response to a step input in the open loop. It is also the residence time of liquid in a stirred tank.
, which is the time required for the distributed lag to reach 63.2% of the full response to a step input in the open loop. It is also the residence time of liquid in a stirred tank.
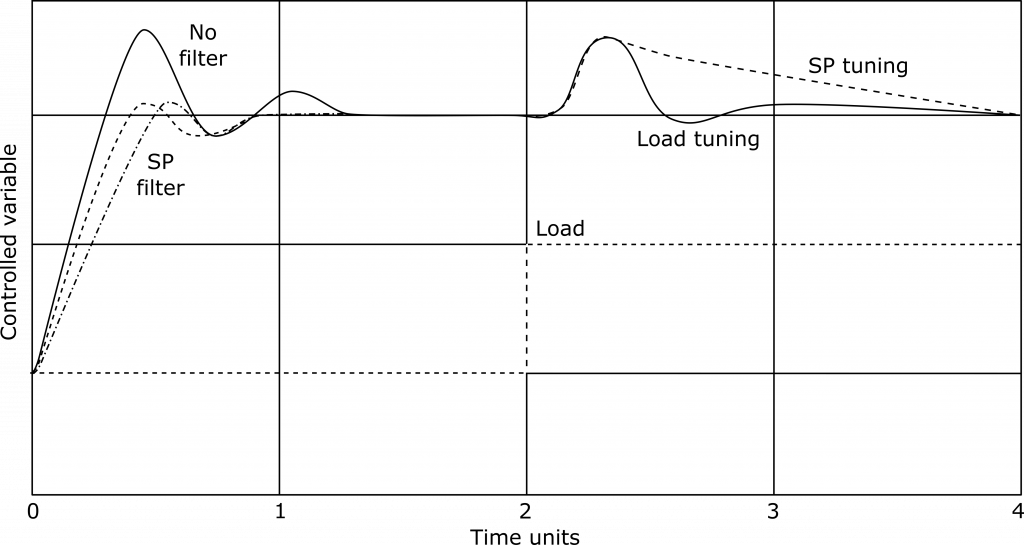
Figure 12.3 [Set-point tuning slows load recovery for lag-dominant processes]
The response shown in the dashed line (SP tuning) is produced when the PID settings are adjusted to minimize the Integrated Absolute Error (IAE) in response to a set point change. It can be observed that following a step change in load, the return to the set point is slow, which is a common behavior for lag-dominant processes. On the other hand, the PID settings that result in the minimum-IAE load response, shown in black (no filter), lead to a significant set point overshoot.
Set Point Filtering
To achieve optimum load rejection while avoiding a large set point overshoot, it is necessary to reduce the proportional response to set point changes, particularly for lag-dominant processes.
Certain PID controllers offer the capability to completely eliminate the proportional action on set point changes. However, this may lead to a set point undershoot, which can significantly impact the controller response, and should not be used for the secondary controller of a cascade system.
Alternatively, some controllers can lower the proportional gain of the controller when it responds to set point changes by using a lead-lag filter or a specially designed algorithm.
Open Loop Tuning
A step test is a straightforward approach that can be employed to tune the loop and obtain a basic process model. There are two commonly used methods.
The first method is the process reaction curve, which is not utilized to compute the process model, but rather to determine the tuning parameters that can reject the upsets caused by load changes.
The second method uses the process model by deriving a simplified process model; the tuning parameters are then determined from this model based on either a load rejection or a set point change criterion.
Process Reaction Curve
When a process experiences a step change while at steady state, there is a period of time known as dead time before it starts to react (shown in Figure 12.4). Following the dead time, most processes will reach a maximum reaction rate, after which the rate will decrease (for self-regulating processes) or remain constant (for integrating processes).
To tune a loop for removing disturbances caused by load changes, the controller needs to react at its maximum rate of reaction, and the strength of the reaction should correspond to the maximum speed. Therefore, it is not necessary to know the process model when tuning the loop. All that is required is the dead time and the maximum speed to calculate the tuning parameters.
Figure 12.4 depicts the response of a temperature loop after a step change in the controller output, which is used as an example throughout this section to illustrate the differences between the recommended settings derived from various tuning techniques.
While it is not possible to determine the process model from this curve because it is too short to indicate whether the reaction rate remains constant or decreases (for self-regulating processes), the tuning parameters for load rejection can be estimated from each test.
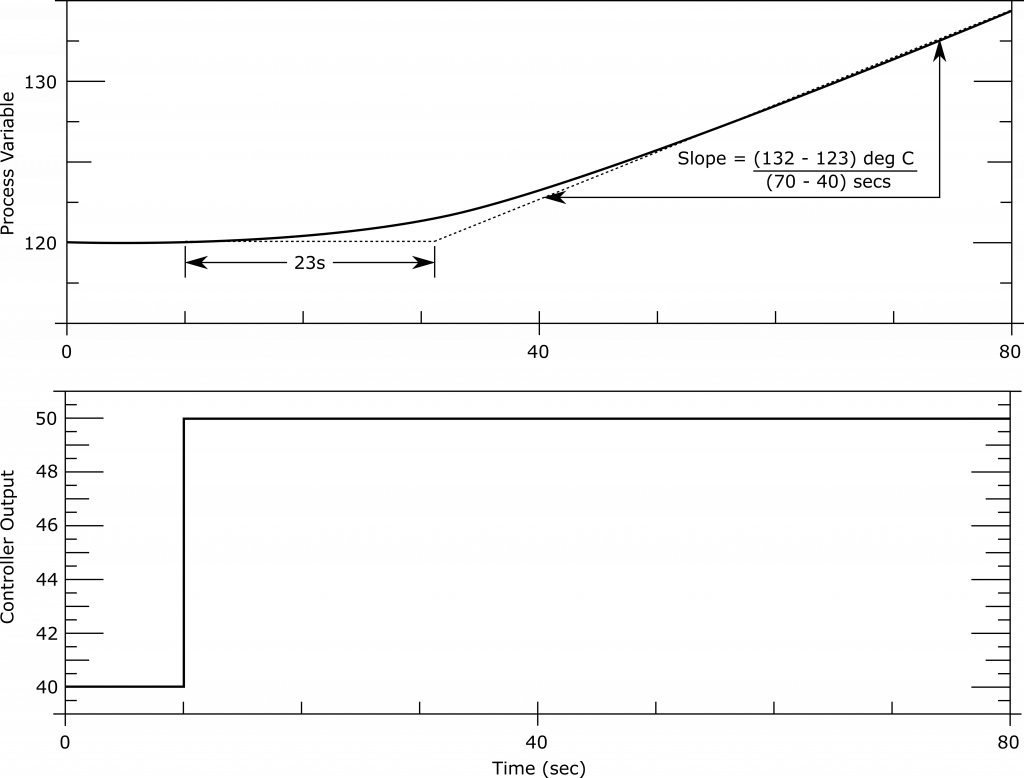
Figure 12.4 [Process reaction curve in response of a change in controller output (CO). The process variable (PV) range is 0 to 300 ![]() and the CO range is 0 to 100%]
and the CO range is 0 to 100%]
As can be seen from Figure 12.4, a 10% change in CO was applied at 10 seconds and the temperature started to increase 23 seconds later at 33 seconds. Hence the dead time (![]() ) is 23s and the reaction rate (speed) is:
) is 23s and the reaction rate (speed) is:
(1) ![]()
The slope is:
(2) ![]()
And after the dead time (![]() ) and the reaction rate (
) and the reaction rate (![]() ) have been determined, the controller settings are calculated by using the equations in Table 1.1.
) have been determined, the controller settings are calculated by using the equations in Table 1.1.

Table 12.1 [Equations for Calculating the Ziegler-Nichols Tuning Parameters for an Interacting Controller]
If a PI controller is to be used for the process that was tested in Figure 12.4, the values are:
(3) ![]()
(4) ![]()
Ziegler and Nichols recommend a method to calculate the proportional gain by dividing the controller output by the product of the slope and the dead time. Ideally, a process with a small dead time and slope allows for aggressive manipulation of the controller output to bring the process to set point. The integral and derivative are also calculated using the dead time. If the slope is high, a small controller gain is needed as the process is sensitive and reacts quickly. A long dead time requires a small controller gain as the response is delayed and aggressiveness is limited.
Open-loop tuning has the advantage of speed and does not introduce unpredictable oscillations into the process. However, it is less accurate than closed-loop tuning and may not identify the inflection point of an S-shaped reaction curve when the measurement is noisy or a small step change is used. A possible approach is to use open-loop tuning to obtain an initial tuning set and refine it with a closed-loop technique.
Process Model
The open-loop tuning method provides values for dead time (![]() ) and reaction rate (
) and reaction rate (![]() ) that can be used in various ways. There are several techniques available to approximate the process reaction curve with a simpler model. The most common approximation is a pure time delay plus first-order lag, which is popular because a real-time delay can only be represented by a pure time delay.
) that can be used in various ways. There are several techniques available to approximate the process reaction curve with a simpler model. The most common approximation is a pure time delay plus first-order lag, which is popular because a real-time delay can only be represented by a pure time delay.
Although it is possible to use higher-order lags plus dead time, accurate approximations are difficult to obtain. Therefore, a pure time delay plus a first-order lag is typically used to approximate the real process lag. The dead time is the time period between an upset and when the controller variable first starts to respond. The time constant is the time period it takes for the controlled variable to reach 63.2% of its final (new steady-state) value, or the time it would take for the variable to reach its final value if the initial speed were maintained.
Bump Test
Figure 12.5 illustrates the Ziegler-Nichols method of approximating the process reaction curve using a first-order lag plus a time delay. The first step in this method is to draw a straight-line tangent to the process reaction curve at its point of maximum rate of ascent, which is known as the inflection point. Although this step is easy to visualize, it can be challenging to do in practice, and this is one of the main difficulties of the procedure. Mistakes made at this point can introduce a significant number of errors. The slope of the tangent line is referred to as the reaction rate ![]() . The time between the moment the disturbance was applied and the time at which this line intersects the initial value of the controlled variable before the test is the dead time, or transport time delay
. The time between the moment the disturbance was applied and the time at which this line intersects the initial value of the controlled variable before the test is the dead time, or transport time delay ![]() .
.
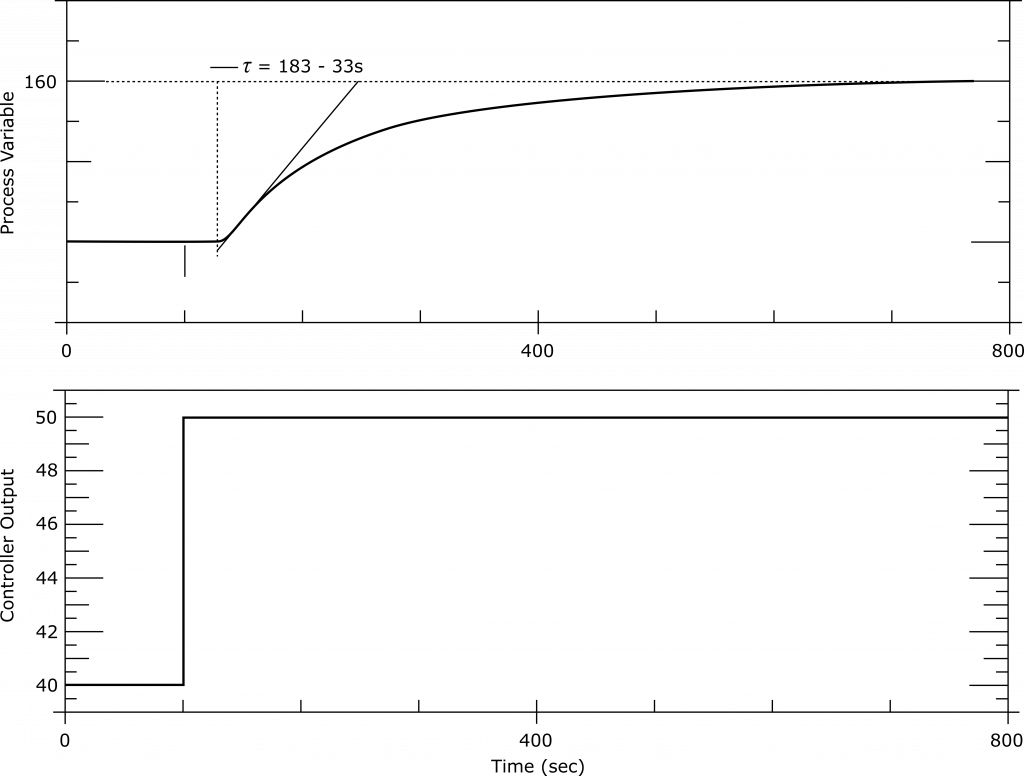
Figure 12.5 [Maximum slope curve, Fit 1]
In Figure 12.5, the values of dead time (![]() ) and reaction rate (
) and reaction rate (![]() ) are determined for a process subjected to a one-unit step change
) are determined for a process subjected to a one-unit step change ![]() in the controller output (manipulated variable). The dead time, or transport time delay, is the time between the instant when the step change was applied and the time at which a tangent line drawn to the process reaction curve intersects the initial value of the controlled variable prior to the test.
in the controller output (manipulated variable). The dead time, or transport time delay, is the time between the instant when the step change was applied and the time at which a tangent line drawn to the process reaction curve intersects the initial value of the controlled variable prior to the test.
The reaction rate, which represents the maximum slope of the process reaction curve, is determined by drawing a straight-line tangent to the curve at the point of maximum rate of ascent (point of inflection). The slope of this line is termed the reaction rate ![]() . It is important to note that the value of
. It is important to note that the value of ![]() does not change significantly with different magnitudes of the controller output step change, while the value of
does not change significantly with different magnitudes of the controller output step change, while the value of ![]() is proportional to the magnitude of the change. Therefore, the value of
is proportional to the magnitude of the change. Therefore, the value of ![]() used in equations or other calculations must be the value obtained for a one-unit change in controller output, regardless of the magnitude used in the actual test.
used in equations or other calculations must be the value obtained for a one-unit change in controller output, regardless of the magnitude used in the actual test.

Figure 12.6 [Bump test, Fit 2]
In addition to the dead time and reaction rate, the value of the process gain K must also be determined as follows:
(5) ![]()
There is a second method to determine the pure time delay plus the first-order lag approximation. In order to distinguish between these two methods, they will be called Fit 1 (described in Figure 12.5) and Fit 2 (described in Figure 12.6). The only difference between these two is in how the first-order time constant is obtained.
In case of Fit 2, the time constant of the process is determined as the difference between the time when the dead time ends and the time when the controlled variable has covered 63.2% of the distance between the pre-test steady state and the new one. The dead time determination by both fits is the same and was already described.
Another method to determine the dead time is to measure the time when the PV moves by 2% of the total change.
The first-order lag time constants are given by:
Fit 1: ![]() (same slope as previous section)
(same slope as previous section)
Fit 2: ![]()
In the above equation (Fit 2), ![]() is the time necessary to reach 63.2% of the final value, and
is the time necessary to reach 63.2% of the final value, and ![]() is the time lapsed between the CO change and the beginning of the PV change. Note that the parameters for Fit 1 are based on a single point on the response curve, which is the point of maximum rate of ascent. However, the parameters obtained with Fit 2 are based on two separate points.
is the time lapsed between the CO change and the beginning of the PV change. Note that the parameters for Fit 1 are based on a single point on the response curve, which is the point of maximum rate of ascent. However, the parameters obtained with Fit 2 are based on two separate points.
The response shown in Figure 1.6 resulted from a ten-unit change in controller output. For different step changes, ![]() and
and ![]() must be adjusted accordingly. From a curve such as in Figure 12.6, a number of parameters can be determined. The controller settings are calculated from the equations in Table 1.2.
must be adjusted accordingly. From a curve such as in Figure 12.6, a number of parameters can be determined. The controller settings are calculated from the equations in Table 1.2.
Table 12.2 compares the results obtained in terms of process gain (K), time constant ![]() , dead time (
, dead time (![]() , and the resulting controller gain
, and the resulting controller gain ![]() and integral time setting
and integral time setting ![]() of a PI controller.
of a PI controller.
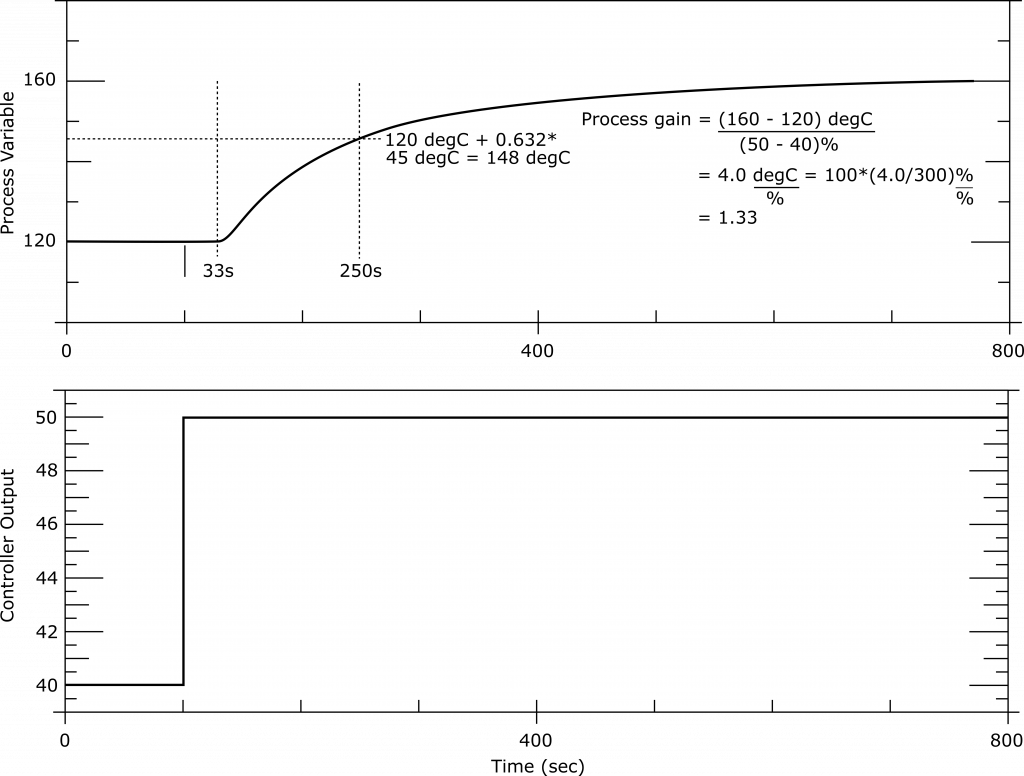
Figure 12.7 [A typical reaction curve using the dead time and time constant obtained by a bump test]

Table 12.2 [Ziegler-Nichols’ Recommendations to obtain the tuning parameters for an interacting controller based on the Readings Calculated from a Model]
Comparing Tuning Methods
Ziegler and Nichols developed a process reaction curve method that requires determining only ![]() and
and ![]() or
or ![]() . The empirical equations, provided in Table x.xj, can be used to predict controller settings that yield a decay ratio of ¼, using these parameters. This approach is suitable for processes that are not “self-regulating,” such as the level control of a tank with constant liquid outflow. To account for self-regulation, Cohen and Coon introduced the index of self-regulation, μ, which can also be determined from the process reaction curve. Cohen and Coon suggested equations in Table 12.3 that account for variations in μ, expressed in terms of
. The empirical equations, provided in Table x.xj, can be used to predict controller settings that yield a decay ratio of ¼, using these parameters. This approach is suitable for processes that are not “self-regulating,” such as the level control of a tank with constant liquid outflow. To account for self-regulation, Cohen and Coon introduced the index of self-regulation, μ, which can also be determined from the process reaction curve. Cohen and Coon suggested equations in Table 12.3 that account for variations in μ, expressed in terms of ![]() and
and ![]() . While a ¼ decay ratio constraint is sufficient for proportional control, proportional-plus-reset control requires a second constraint. This constraint is the smallest error integral or the integral of the error with respect to time. For PID control, a third constraint must be chosen to obtain a unique solution. The 3C Method, based on Cohen and Coon’s work, suggests using a value of 0.5 for the dimensionless group
. While a ¼ decay ratio constraint is sufficient for proportional control, proportional-plus-reset control requires a second constraint. This constraint is the smallest error integral or the integral of the error with respect to time. For PID control, a third constraint must be chosen to obtain a unique solution. The 3C Method, based on Cohen and Coon’s work, suggests using a value of 0.5 for the dimensionless group ![]() to obtain a unique solution. Greg Shinskey suggested a variation where the proportional gain and the integral time are increased.
to obtain a unique solution. Greg Shinskey suggested a variation where the proportional gain and the integral time are increased.
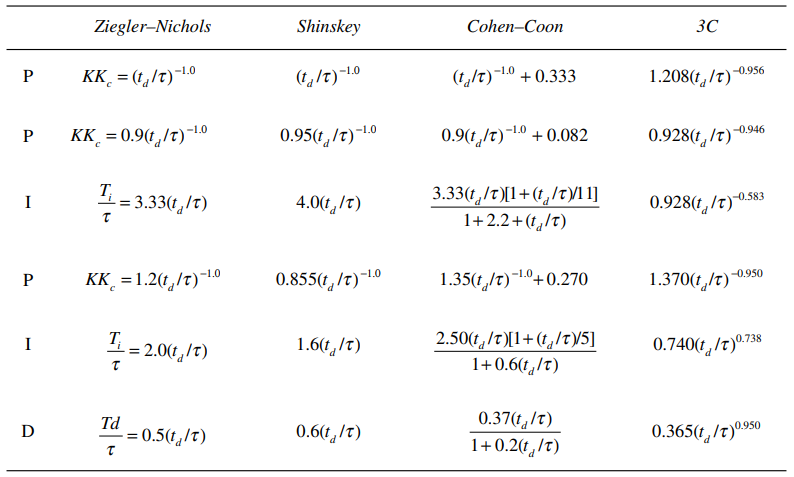
Table 12.3 [Comparison of Equations Recommended by Ziegler-Nichols, Shinskey, Cohen-Coon and 3C for the determination of the Tuning Settings for PID controllers]
Which Disturbance to Tune for
With tuning parameters calculated for load rejection, the integral time ![]() will depend mostly on the dead time
will depend mostly on the dead time ![]() of the process.
of the process.
In contrast, if the tuning parameters are calculated for a set-point change, the integral time will be longer and the derivative time will be shorter, and they will depend mostly on the time constant of the process.
The relationship between the controller settings based on integral criteria and the ratio ![]() is expressed by the tuning relationship given in the following equation.
is expressed by the tuning relationship given in the following equation.
(6) ![]()
Where ![]() for proportional mode,
for proportional mode, ![]() for reset mode,
for reset mode, ![]() for rate mode;
for rate mode; ![]() ,
, ![]() = constant for given controller and mode;
= constant for given controller and mode; ![]() ,
, ![]() = pure delay time and first-order lag time constant. Hence using the following equations:
= pure delay time and first-order lag time constant. Hence using the following equations:
(7) ![]()
(8) ![]()
(9) ![]()
Lambda Tuning
Lambda tuning originated from Dahlin in 1968; it is based on the IMC theory as MPC, is model-based, and uses a model inverse and pole-zero cancellation to achieve the desired closed-loop performance. Lambda tuning is a method to tune loops based on pole placement. This method ensures a defined response after a set-point change but is generally too sluggish to properly reject disturbances. Promoters for this method often claim that all loops should be tuned on the basis of Lambda tuning. Doing so, the controllers are almost in “idling mode” and when the process load changes or other disturbance occurs, the time to eliminate this disturbance is quite long for most processes due to the integral time selected equalling the process time constant.
The promoters also suggest the use of a closed-loop time constant, which is three times the process time constant. During so, the response time in the automatic mode will be three times longer than in manual. Therefore, the response time will be slower in automatic. This is adequate if no disturbance occurs but if no disturbance occurs, the control loop is not needed.
“Lambda tuning” refers to all tuning methods where the control loop speed of response is a selectable tuning parameter. The closed-loop time constant is referred to as “Lambda” ![]() . Therefore, following a set-point change the PV will reach set-point as a first-order system.
. Therefore, following a set-point change the PV will reach set-point as a first-order system.
Lambda tuning has been widely used in pulp and paper industry, but control specialists are starting to realize that it is often too sluggish to handle disturbances. For a first-order plus dead time model:
(10) ![]()
(11) ![]()
Where ![]() = closed loop time constant; it is recommended to use
= closed loop time constant; it is recommended to use ![]() .
.
The performance of lambda tuning is unacceptable for correcting upsets caused by load changes if the process time constant is larger than the dead time. This is the case with pressure, level and temperature control applications.
In Table 12.4. Fit 2 (Figure 12.6) will be used as the reference to compare the process models found using the different tuning criteria.
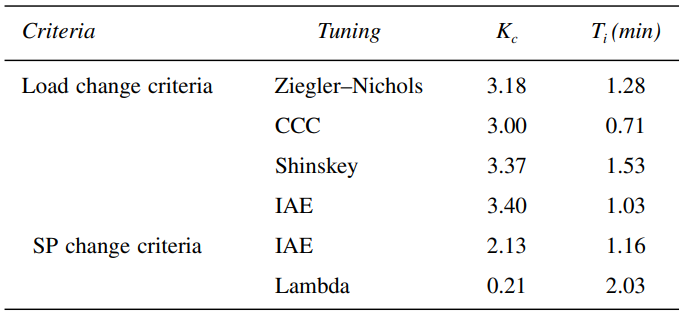
Table 12.4 [The Tuning Setting Recommendations for a PI Controller Resulting from the Criteria Listed]
Adjusting Robustness
In order to increase the robustness and reduce oscillations in a control loop, some performance must be sacrificed. A common approach is to decrease the proportional gain, which can help increase robustness and reduce or eliminate oscillations.
As a general rule, reducing the proportional gain by a factor of two will eliminate oscillations, while reducing it again by another factor of two will eliminate most of the overshoot.
Closed Loop Response Methods
In the open-loop tuning method, the controller settings can be determined without the need to install the controller. On the other hand, in the closed-loop tuning method, the controller is in automatic mode or in-service during tuning. Two commonly used closed-loop tuning methods are the ultimate method and the damped oscillation method.
Ultimate Method
Ziegler and Nichols proposed the ultimate method as one of the first techniques for tuning controllers in 1942. This method requires determining the ultimate gain and the ultimate period, hence its name. The ultimate gain (![]() ) is the maximum gain for which the closed loop remains stable, and the ultimate period is the time period of the system response when the gain is set at its ultimate value (as shown in Figure 12.5).
) is the maximum gain for which the closed loop remains stable, and the ultimate period is the time period of the system response when the gain is set at its ultimate value (as shown in Figure 12.5).
To achieve a quarter-amplitude damping in a closed loop (as depicted in Figure 12.2), the loop gain must be at least 0.5. This means that the product of gains of all the loop components, including process gain (![]() ), sensor gain (
), sensor gain (![]() ), transmitter gain (
), transmitter gain (![]() ), controller gain (
), controller gain (![]() ), and control valve gain (
), and control valve gain (![]() ), must be greater than or equal to 0.5. When the loop is oscillating with a constant amplitude (Curve B in Figure 12.5), the gain product of the loop is 1.0.
), must be greater than or equal to 0.5. When the loop is oscillating with a constant amplitude (Curve B in Figure 12.5), the gain product of the loop is 1.0.
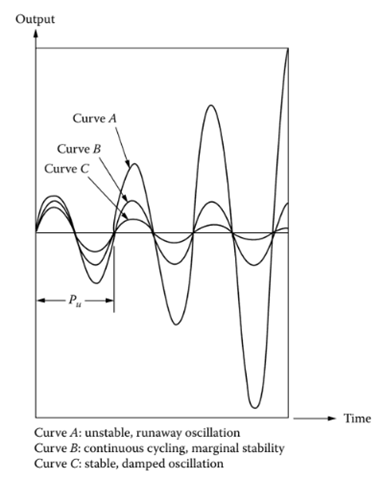
Figure 12.5 [Ultimate gain is the gain that causes continuous cycling (Curve B) and ultimate period (Pu) is the period of that cycling]
The oscillation period of a closed loop is mostly dependent on the amount of dead time in the loop, with different process types having specific ranges. Flow loops oscillate with a period of 1 to 3 seconds, level loops with 3 to 30 seconds, pressure loops with 5 to 100 seconds, temperature loops with 0.5 to 20 minutes, and analytical loops from 2 minutes to several hours.
Analog controllers with no dead time added by sampling cause plain proportional loops to oscillate with periods ranging from two to five dead times, PI loops with periods of three to five dead times, and PID loops at around three dead time periods.
However, the tuning parameters determined by this method are based on load disturbance rejection and are not suitable for set-point changes. Tuning parameters for set-point changes are different and require a process model for their determination.
The optimal integral and derivative settings for controllers vary depending on the number of modes in the controller (P = 1, PI = 2 modes, PID = 3 modes) and the amount of dead time in the loop. For non-interacting PI controllers with no noticeable dead time, the integral ![]() should be set to about 75% of the oscillation period.
should be set to about 75% of the oscillation period.
As the dead time-to-time constant ratio increases, the integral setting becomes a smaller percentage of the oscillation period. At a dead time equal to 20% of the time constant, (T_i) drops to around 60%, at 50% dead time, (T_i) is about 50%, when they are equal (T_i) is around 33%, and when the dead time exceeds the time constant, (T_i) drops to around 25%.
For non-interacting PID loops with no dead time, the integral (I) should be set to 50% of the period of oscillation and the derivative time (D) to around 18% of the period. As the dead time increases to 20% of the time constant, (I) drops to 45% and (D) to 17% of the period. At 50% dead time, (I) is 40%, and (D) is 16%. When the dead time equals the time constant, (I) is 33%, and (D) is 13%. Finally, if dead time is twice the time constant, (I) is 25%, and (D) is 12%.
Damped Oscillation Method
Harriott has suggested a revised approach to the previous procedure, as some processes cannot support continuous oscillations, making the ultimate method impractical. In this modified version of the ultimate method, the gain (with only proportional control) is fine-tuned in a step-wise manner similar to the ultimate method until a response curve with a decay ratio of 1/4 is achieved. However, when using this tuning method, it is only necessary to take note of the response period P.

Table 12.5 [Harriott Tuning Parameters for a Noninteracting Controller Calculated from ![]() Obtained to Reach a Quarter-of-Amplitude Decay]
Obtained to Reach a Quarter-of-Amplitude Decay]
Advantages and Disadvantages
The ultimate and damped oscillation methods have two main drawbacks. Firstly, both methods are essentially trial-and-error, as multiple gain values must be tested before determining the ultimate gain or the gain required for a ¼ decay ratio. When testing a value close to the desired gain, it can often take several oscillations before it can be determined if the trial gain value is correct.
Secondly, while one loop is being tested in this way, its output may impact several other loops, potentially disrupting the entire system. While all tuning methods require some changes to the control loop, other techniques only require one test and not multiple tests as with closed-loop methods.
Additionally, if the tuning parameters are too aggressive, increasing the proportional band (or decreasing the proportional gain) can achieve the expected response. However, this may require modifications to the integral and derivative settings. For instance, reducing the proportional gain to 3.5 can result in a quarter-of-amplitude decay.